Austin Real Estate Market Overview
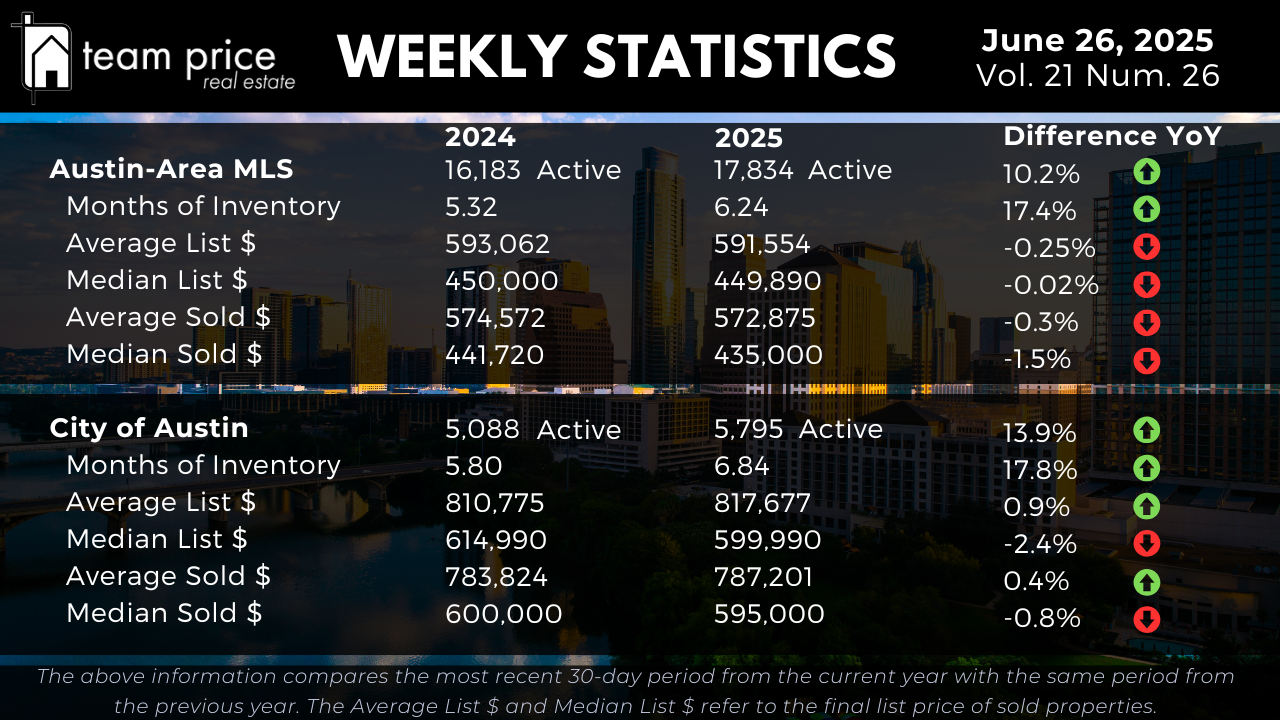
Inventory across the Austin-Area MLS continues to climb, reinforcing the market’s ongoing shift toward more balanced—and in some cases, buyer-favorable—conditions. As of this week, there are 17,834 active residential listings, marking a 10.2% increase from the same period in 2024. Months of Inventory has risen from 5.32 to 6.24, a 17.4% increase year over year, reflecting a slower pace of absorption and consistent listing activity. Within the City of Austin, inventory growth is even more pronounced. Active residential listings have increased by 13.9% year over year to 5,795, while Months of Inventory has climbed from 5.80 to 6.84, a 17.8% gain. These inventory metrics confirm that while buyer activity has moderated, seller activity remains steady, contributing to an environment where competition among sellers is building, and buyers have more options to consider.
Austin Housing Prices: Gradual Pressure Builds
Price trends across the Austin-area MLS continue to reflect the broader inventory dynamics. The average list price for active homes is now $591,554, a slight year-over-year decline of 0.25%. The median list price is holding nearly flat at $449,890, down just 0.02%. On the sold side, prices show mild but consistent downward pressure. The average sold price has dipped 0.3% year over year to $572,875, while the median sold price has fallen 1.5% to $435,000. These figures illustrate a market that remains stable in broad terms but is experiencing incremental softening as inventory accumulates and buyers exercise greater caution.
Within the City of Austin, price performance remains segmented. The average list price has increased 0.9% over the past year to $817,677, signaling strength at the higher end of the market. Conversely, the median list price has declined 2.4% to $599,990, suggesting downward pressure on mid-range and entry-level listings. The average sold price in the city has edged up slightly by 0.4% to $787,201, while the median sold price has slipped 0.8% to $595,000. This divergence between average and median pricing continues to highlight a segmented market where higher-priced or turnkey properties attract attention, while affordability challenges weigh on the middle of the market.
Regional Trends: Price Gains Uneven Across Central Texas
Regional pricing trends remain inconsistent across Central Texas. Of the 30 cities tracked, 63% experienced month-over-month price increases, while 33% saw price declines. On a year-over-year basis, 53% of cities posted price increases, with the remaining 47% seeing declines. However, none of the 30 cities currently sit above their peak pricing from the past 12 months. Every market has experienced some degree of retracement, underscoring the broad nature of the correction underway.
At the ZIP code level, similar patterns persist. Among the 75 ZIP codes monitored, 51% saw month-over-month price increases, while 48% experienced declines. Year over year, 44% of ZIP codes posted price gains, while 56% saw decreases. Only one ZIP code remains above its 12-month pricing peak, reinforcing that the regional market correction is still widely felt. These figures collectively highlight a market marked by fragmented recovery signals but lacking sustained upward momentum.
List-to-Sale Price Performance: Modest Negotiation Continues
Negotiation remains a defining characteristic of the Austin housing market. As of this month, 66.90% of closed sales in the Austin-area MLS were below list price, an increase from 62.91% the previous month and higher than the 63.42% recorded one year ago. Sales closing at list price account for 20.96% of transactions, while just 12.15% of homes sold above list—a continued monthly and annual decline. The average sold-to-list price ratio now stands at 97.27%, indicating that while homes continue to trade near asking price, the majority of sellers are accepting modest concessions. Well-priced, well-presented properties are still attracting buyer interest, but overall, the market remains sensitive to pricing and strategic in its negotiations.
Peak Value Trends: Still Well Below the Top
The Austin market continues to operate well below its peak values across all major pricing metrics. In the Austin-Area MLS, the average list price peaked at $717,539 in April 2025 and has since declined to $657,388—a drop of 8.4%. The median list price has fallen 12.0% from its May 2022 peak of $539,900 to $475,000. The average sold price has declined 11.3% from its May 2022 peak of $664,515 to $589,203, while the median sold price has dropped 15.9% from $538,000 to $452,350. Price per square foot has also seen significant reductions. The average price per square foot is down 19.8%, from $324 to $260, and the median is down 21.4%, from $280 to $220. These figures confirm that while recent months have brought relative price stability, the broader correction from peak levels remains firmly intact.
In the City of Austin, the trajectory is similar. The average list price peaked at $952,166 in April 2025 and now sits at $832,977, a decline of 12.5%. The median list price has fallen 13.1% from $667,000 to $579,950. The average sold price is down 6.3% from its May 2022 peak of $847,583 to $794,034, while the median sold price has declined 11.8% from $680,000 to $600,000. Price per square foot has also weakened notably, with the average down 19.2% from $442 to $357 and the median down 20.9% from $393 to $311. These declines illustrate the depth of the correction and signal that despite temporary pockets of demand, the overall market remains on a lower pricing plateau compared to recent highs.